- Published on
Xcode test lag
- Authors

- Name
- Jack Youstra
- @jackyoustra
At this point, the rewrite of NanoFlick to TCA is mostly complete. The uFeatures architecture coupled with the testing framework is very, very nice - most incremental debugging loops (build, launch, and runtime) are around a second. Unfortunately, there's a long, long main thread-blocking hang (about 8-10 seconds) between build and launch. What gives?
Profiling
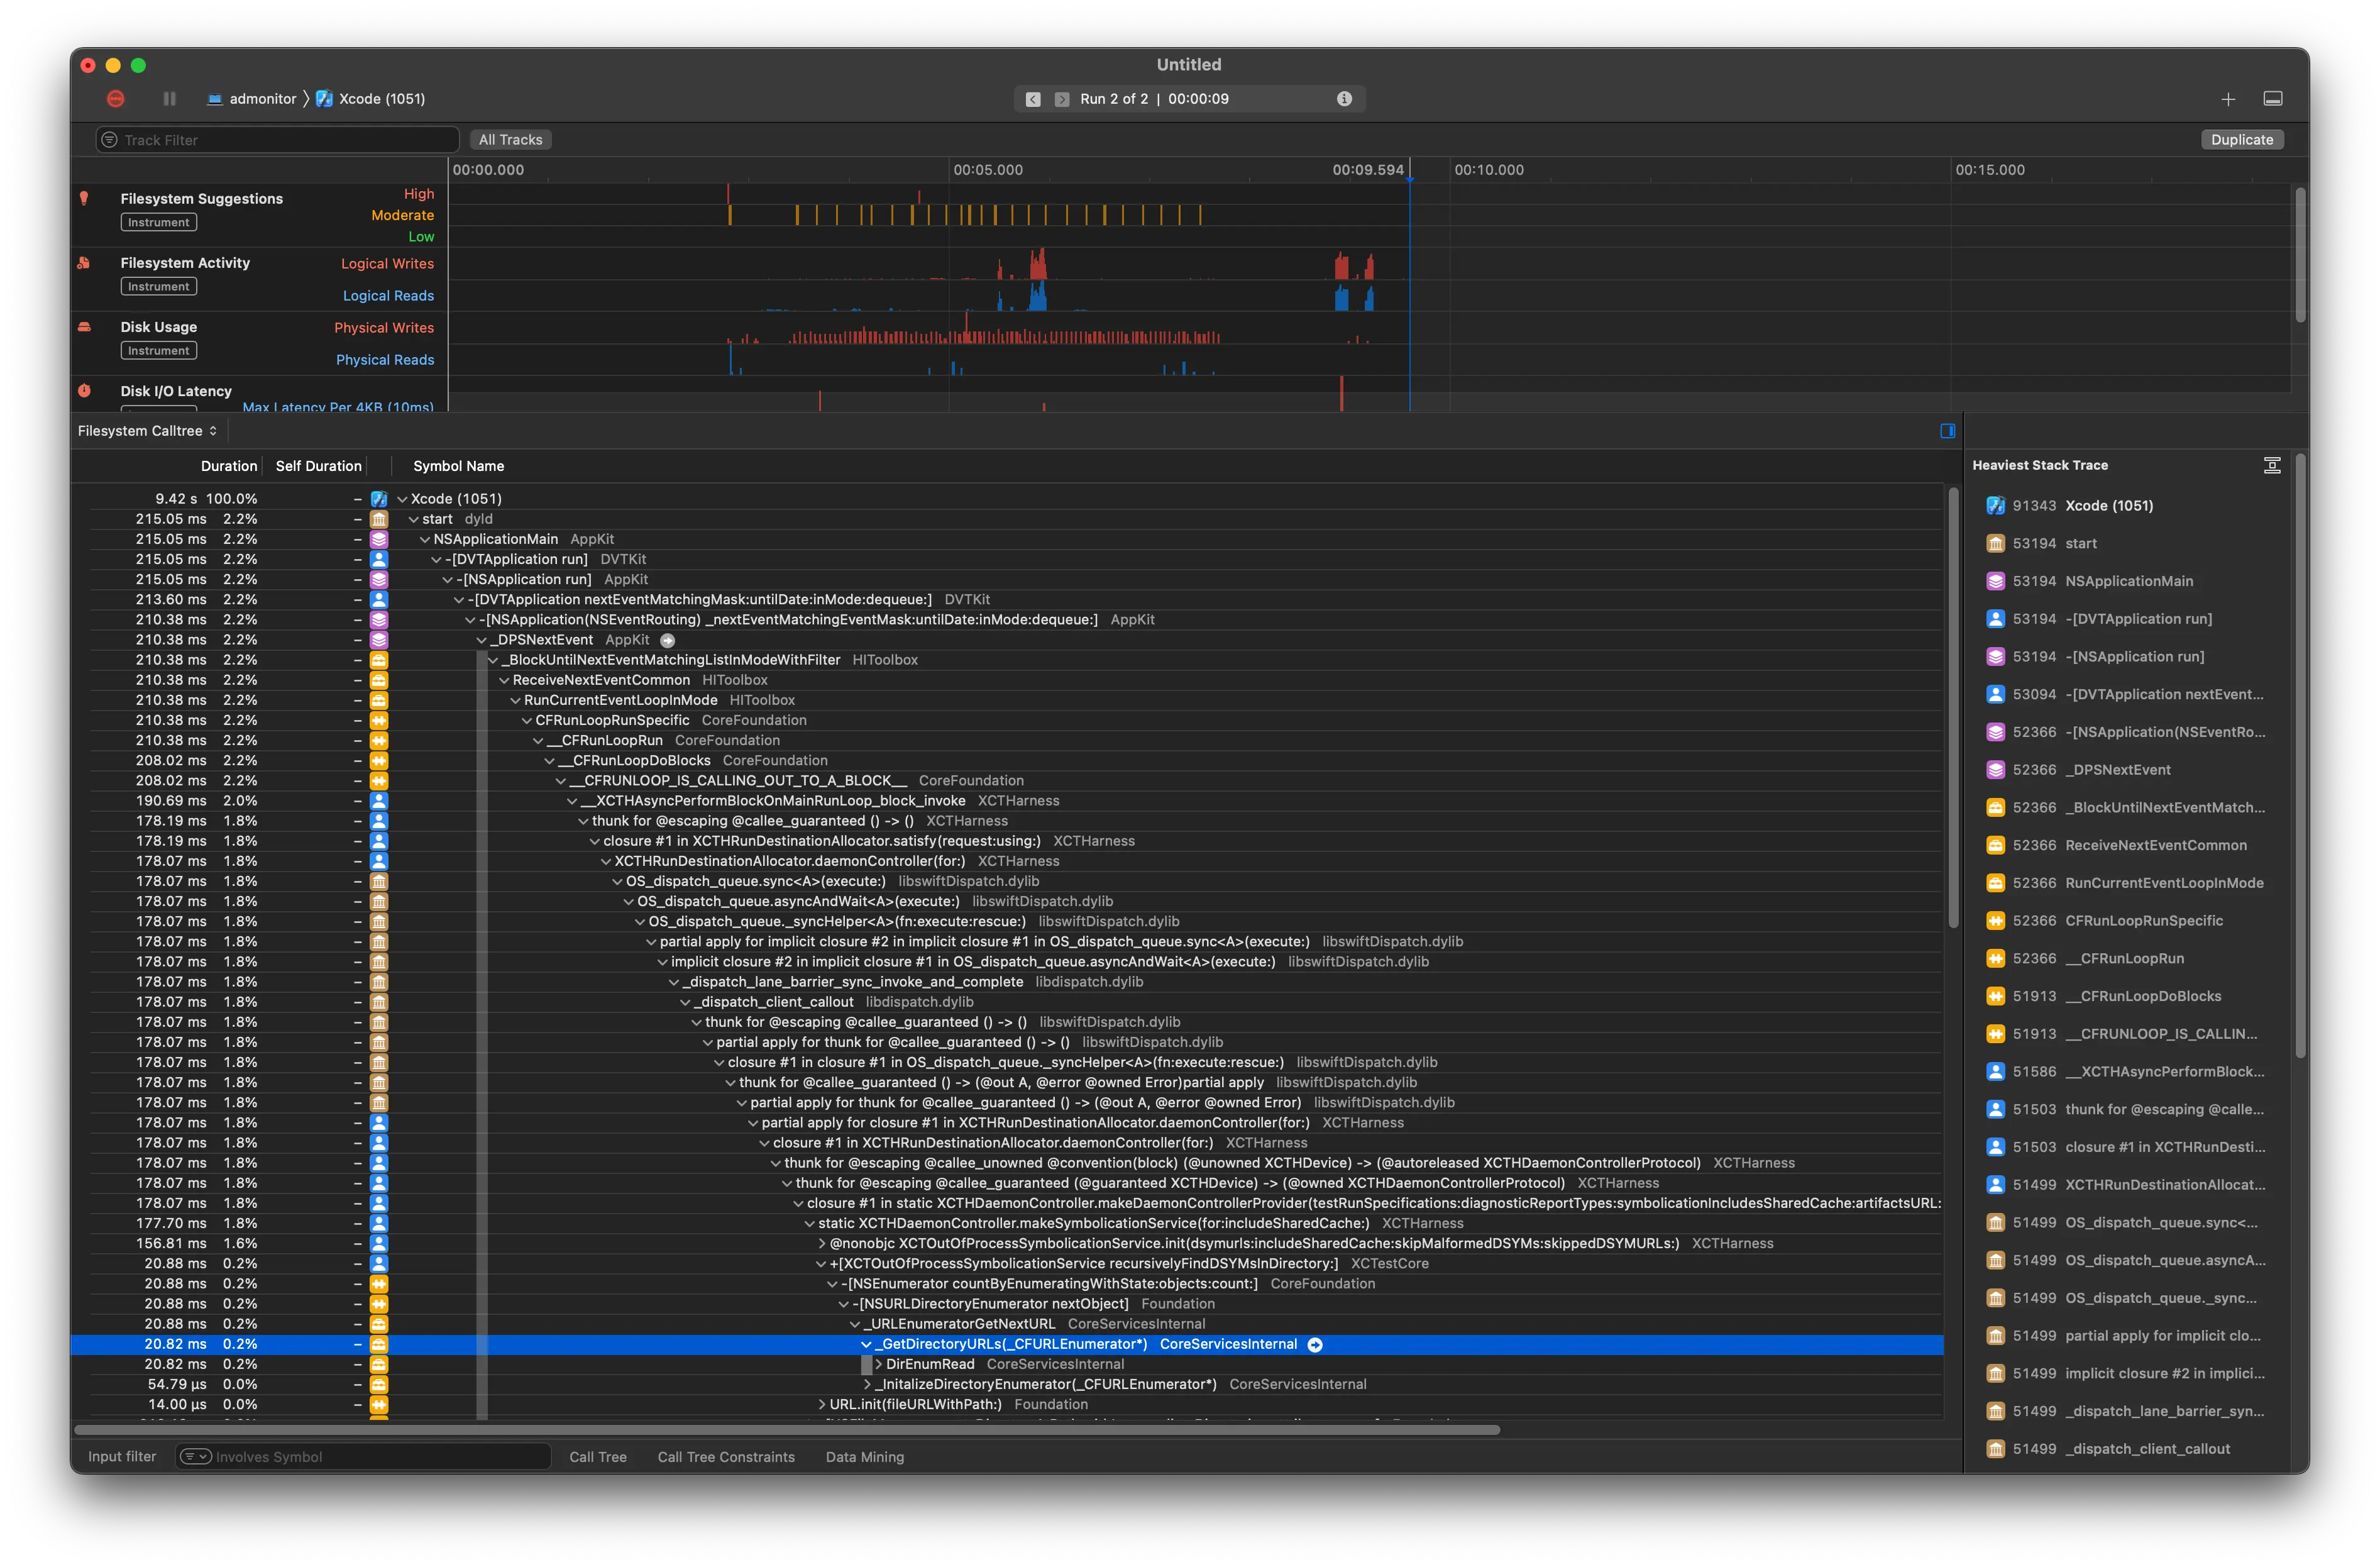
The first tool to turn to is Instruments, run on xcode itself. Because we're seeing a hang, we'll use the Animation Hitches tool (we probably could have used the Time Profiler or System Trace tool, but I'll use the tool most suited to the job until proven otherwise). We wait about an hour for instruments to process the ten second (!!!) analysis stream and look at the results. If we're blocking on a subprocess, we'll probably have to find some other way, but fortune smiles upon us. We see a big hang!
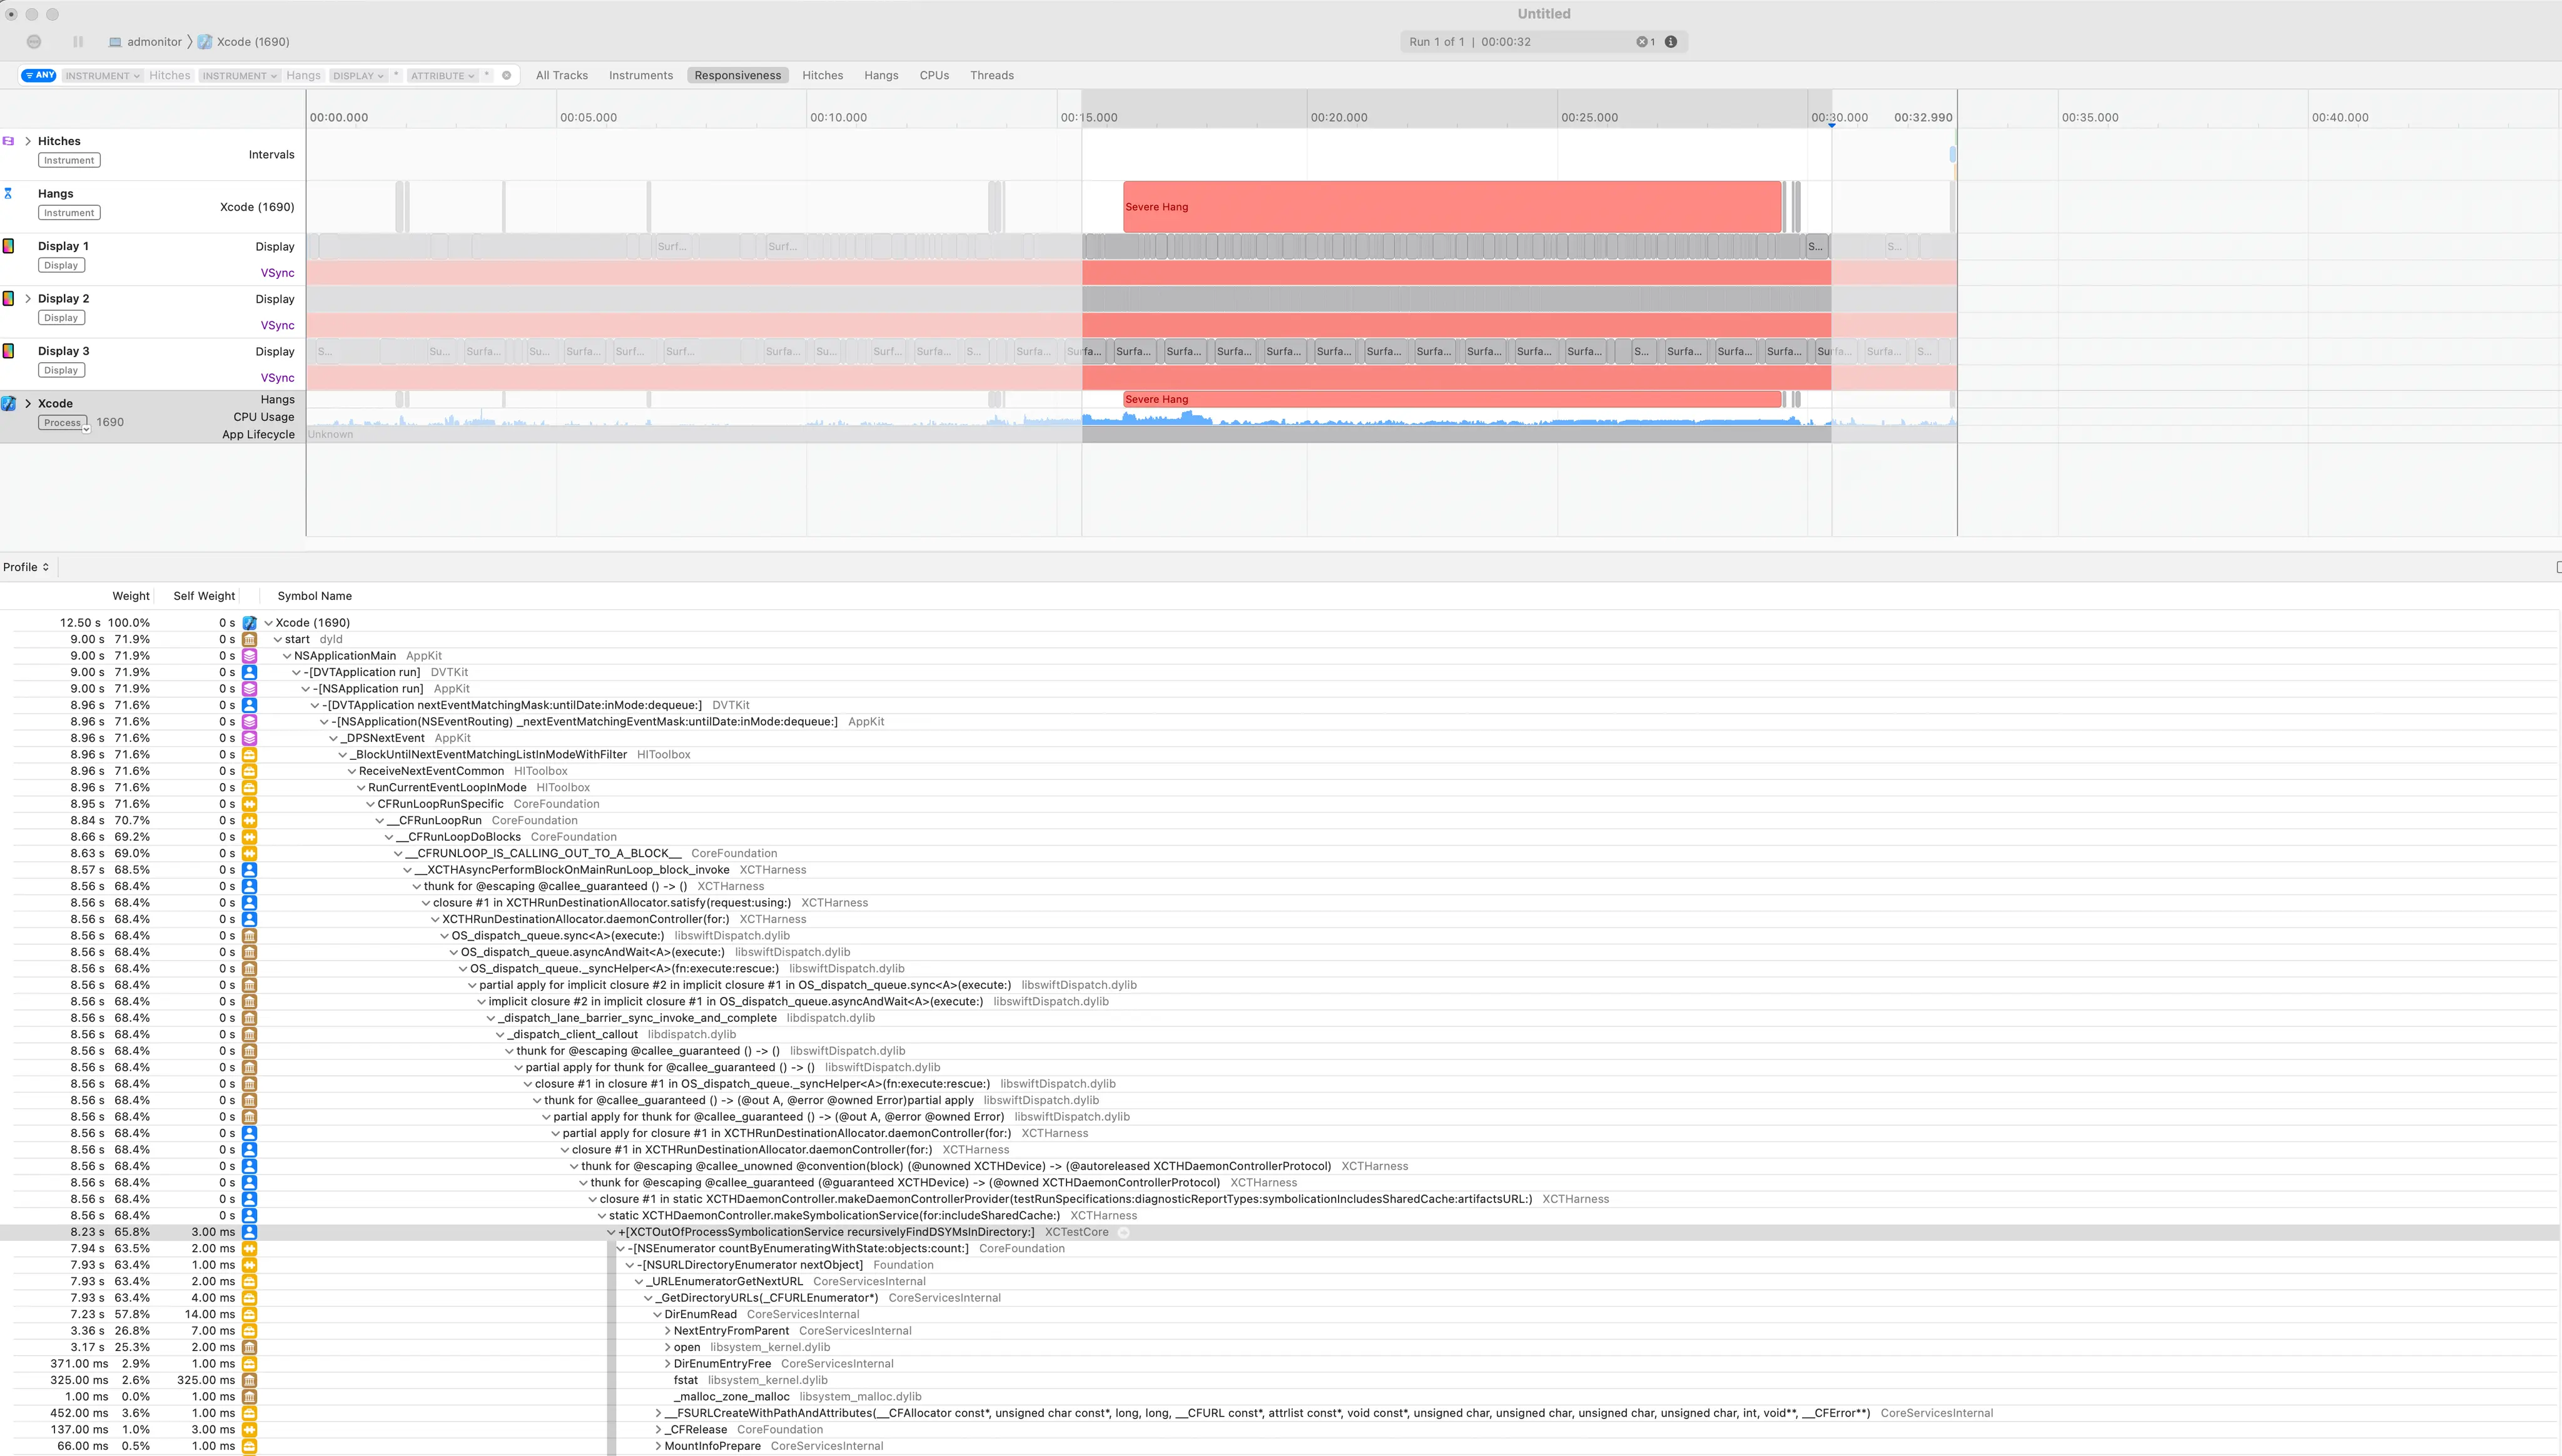
The offending spot seems to be main-thread blocking file calls (y'know, literally THE reason to do any sort of concurrent (not even parallel!) code, but whatever xcode) in [XCTOutOfProcessSymbolicationService recursivelyFindDSYMsInDirectory:]. Googling didn't turn up anything useful on this method, so we have to continue our search.
Switching to logging for IO ops with Instruments' File Activity tool, we see about 7-8 seconds of IO ops (which is about the same as the hang time). Most of it is in open, fsync, and read calls. Looking at the Disk Usage tab, we can see that basically all of the physical time (3.8 seconds) is taken up by Metadata Read.
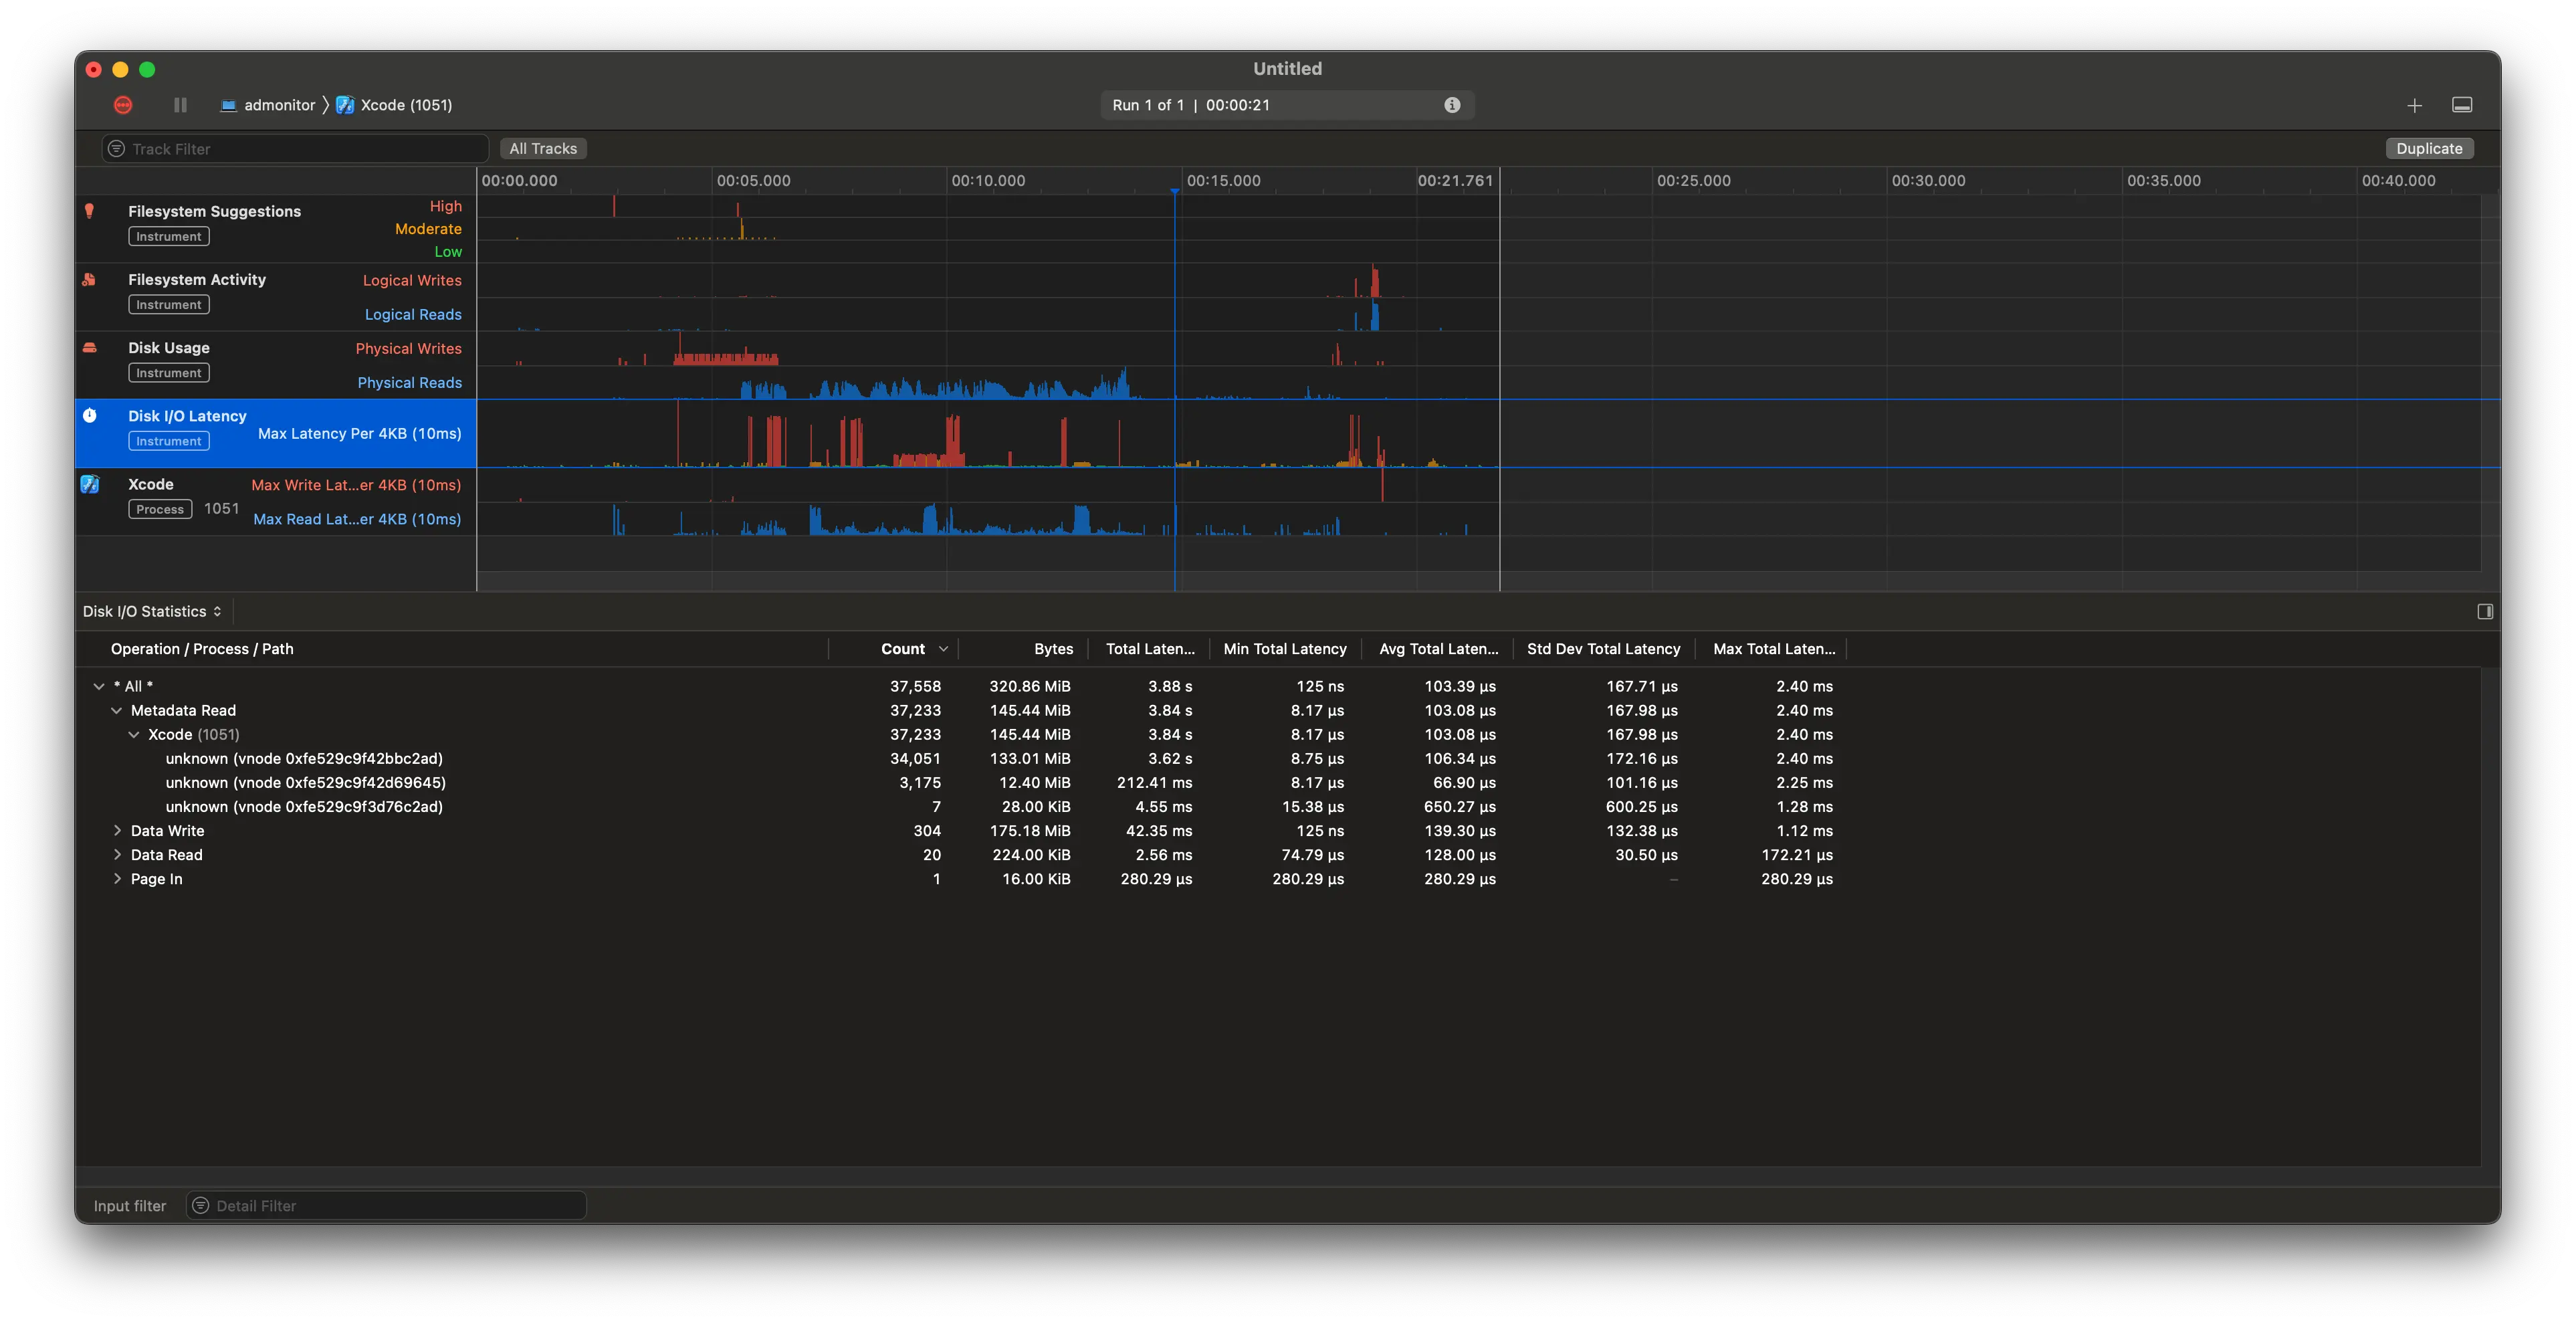
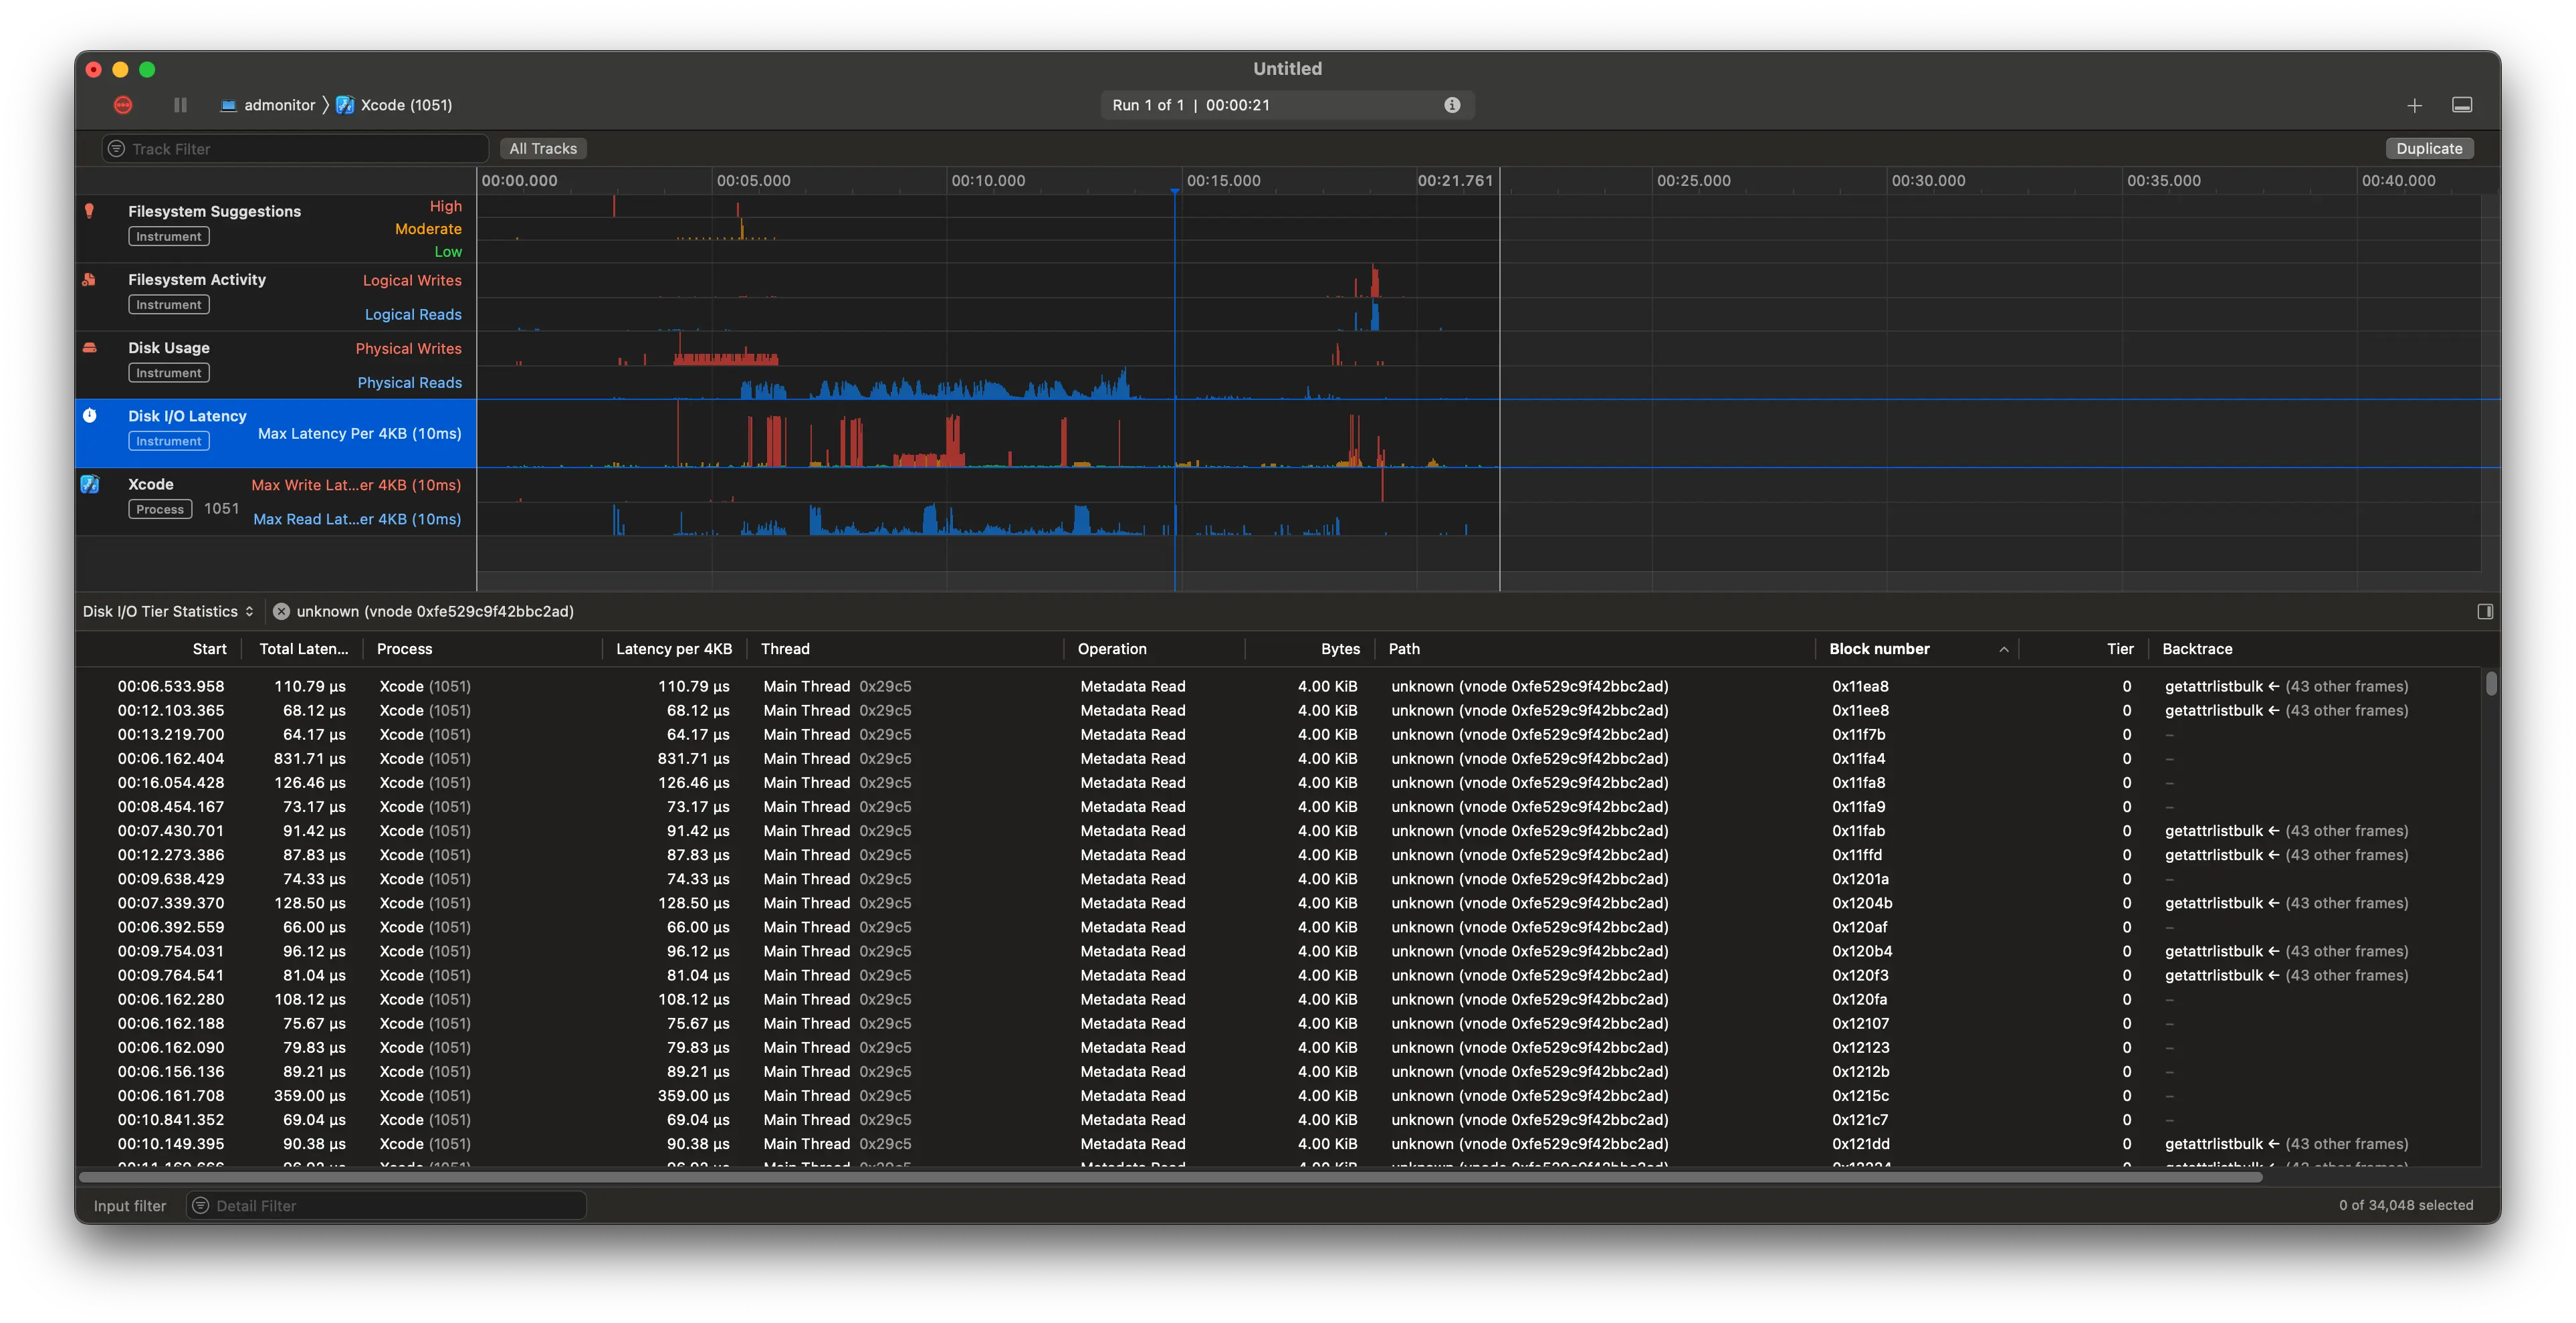
Unfortunately, I can't seem to find any paths! While a lot of the negligible traces have associated paths, all I get for the big ones is unknown and a big garbled vnode number.
The vnode is probably referring to XNU's vnode type.
What's a vnode?
Some quick OS background: most OSes now implement a virtual file system (VFS)1, which is a layer of abstraction that allows for most resources to be treated as files, regardless of their actual implementation. Here's a good graphic on this and a clickable one from Wikipedia that unfortunately has all of the labels invisible. Oops. For example: a file on disk, a network socket, and a process are all files in the VFS. Additionally, if you have something that looks like a file, but doesn't have the same logic as "local file on disk", you can write your own VFS driver to handle it,2 including a userspace-delegating one like FUSE. In these, the driver is a thin layer that translates VFS calls to userspace calls, and the userspace process handles the rest. This is how beloved tools like sshfs are implemented, which let me do work on the UT computing cluster from my dorm in my college days.
In this case, the vnode is probably referring to an inode3, but getting an inode from a vnode is... not straightforward. This, by the way, would only be feasible if we had a way to resolve files from inodes, which we don't. fsck_apfs only seems to report corrupted inode numbers, and fsstat probably doesn't have APFS support, and, more to the point, I can't find any tools with good APFS support, let alone macOS ones with online monitoring support.
Fortunately, knowing the vnode gives us a very convenient syscall: vn_getpath, which gives us the path from a vnode. I'm curious if that's what Instruments uses, but, because it's a kernel syscall, I'd probably have to write a kext to try it out, and I'm just not that curious.
The rest of the internet isn't so helpful with my vnode problem: while there's some writing on debugging vnode issues, especially related to handle exhaustion, there's not much on how to get the path from a vnode, assuming we even can.
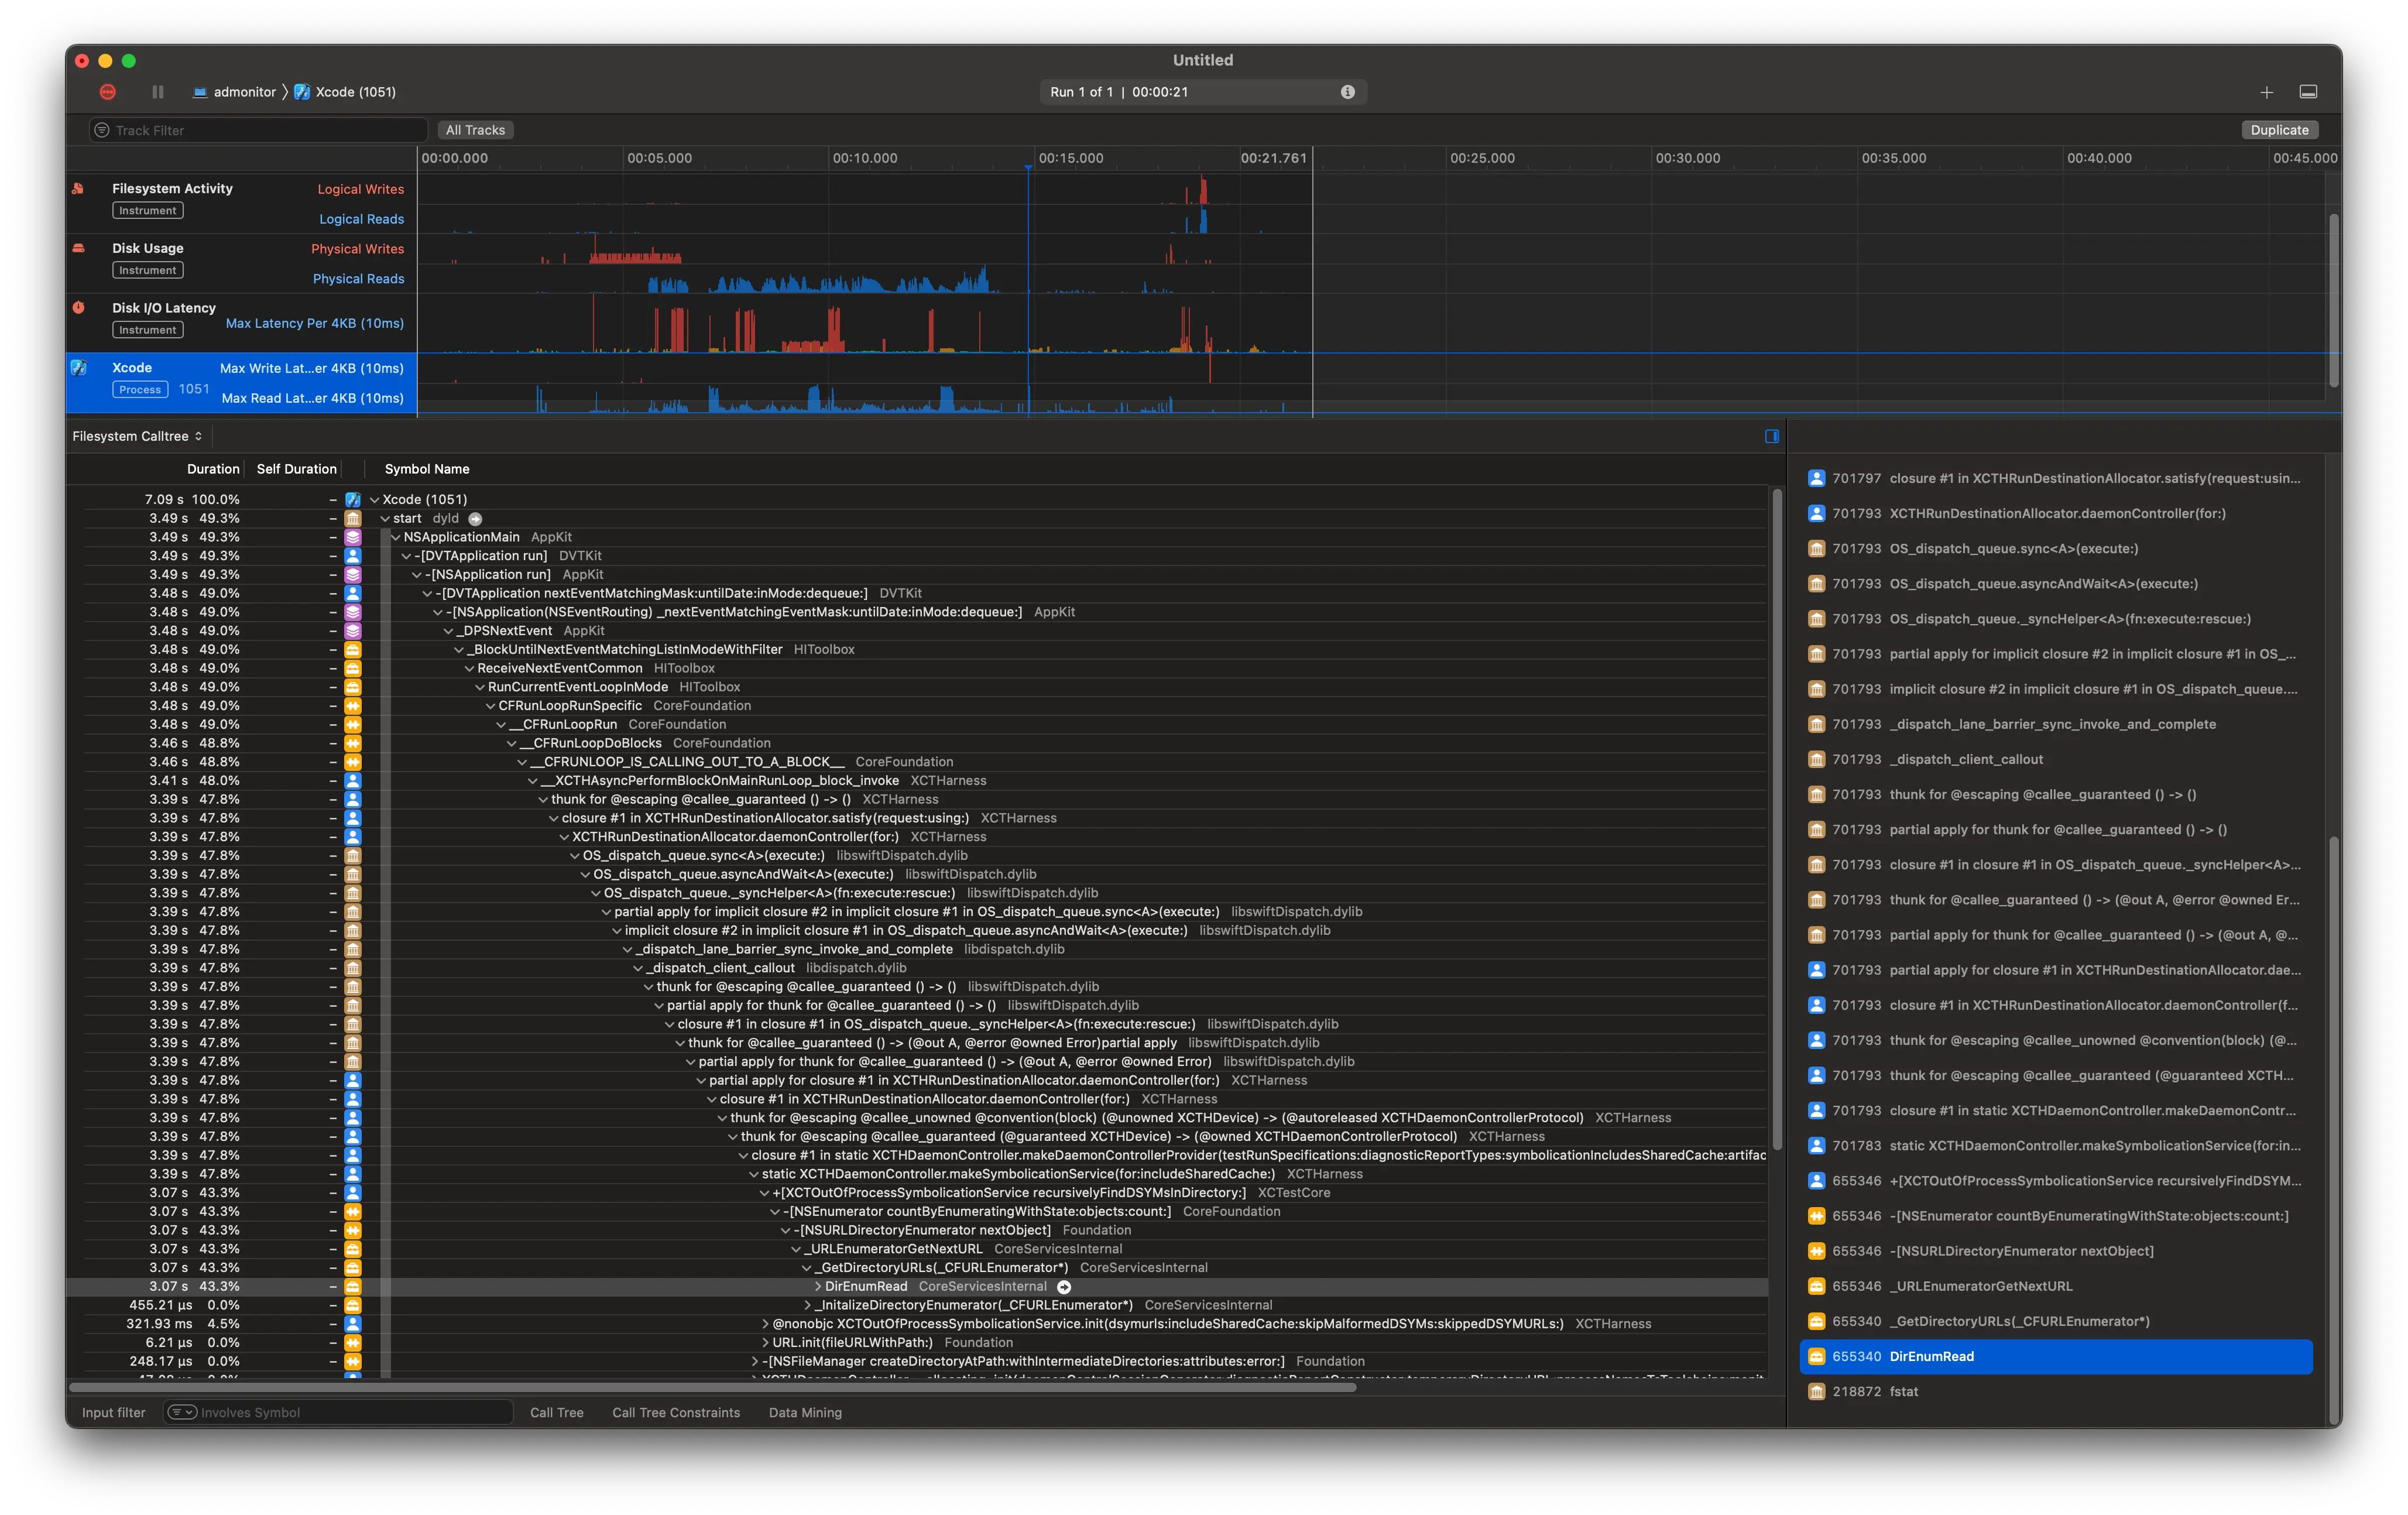
I'm starting to revise my assessment that vnodes -> files, though, because there's an absolutely gargantuan number of operations to this vnode: 34k physical file operations in this short period of time, each taking way longer than they should if the results were cached at all. However, each has a variable block number, whatever that is. Some more reading shows that the block number is a selector on the data contained by a vnode. We see most of these calls go to getattrlistbulk, which you can read about here, but please just type man getattrlistbulk into your terminal instead - it looks a lot nicer.
It looks like that's called for all subdirections - the big blocking op is an uncached read of the directory structure, which requires calling getattrlistbulk ~34k times.
Again, we don't know where this is happening, although my money is on DerivedData, because that's where the build artifacts are stored.
🛑NO VNODE 🛑 try something else
Stepping away from vnodes and looking afresh, I notice again that most of the latency is in open calls. Running through those, we notice that the Narrative tab of the File Activity tool shows basically no Unknown calls. Yay! We can see the paths, and, in conjunction with the trace stored for each call, we can see what paths are attributed to our culprit method.
There seems to be some string corruption4 - all of these paths are partial paths, some with fragments taken out of the middle, but fortunately two bugs make a right - there are a lot of calls to open with the same path, so we can just look over a few of them to see some patterns.
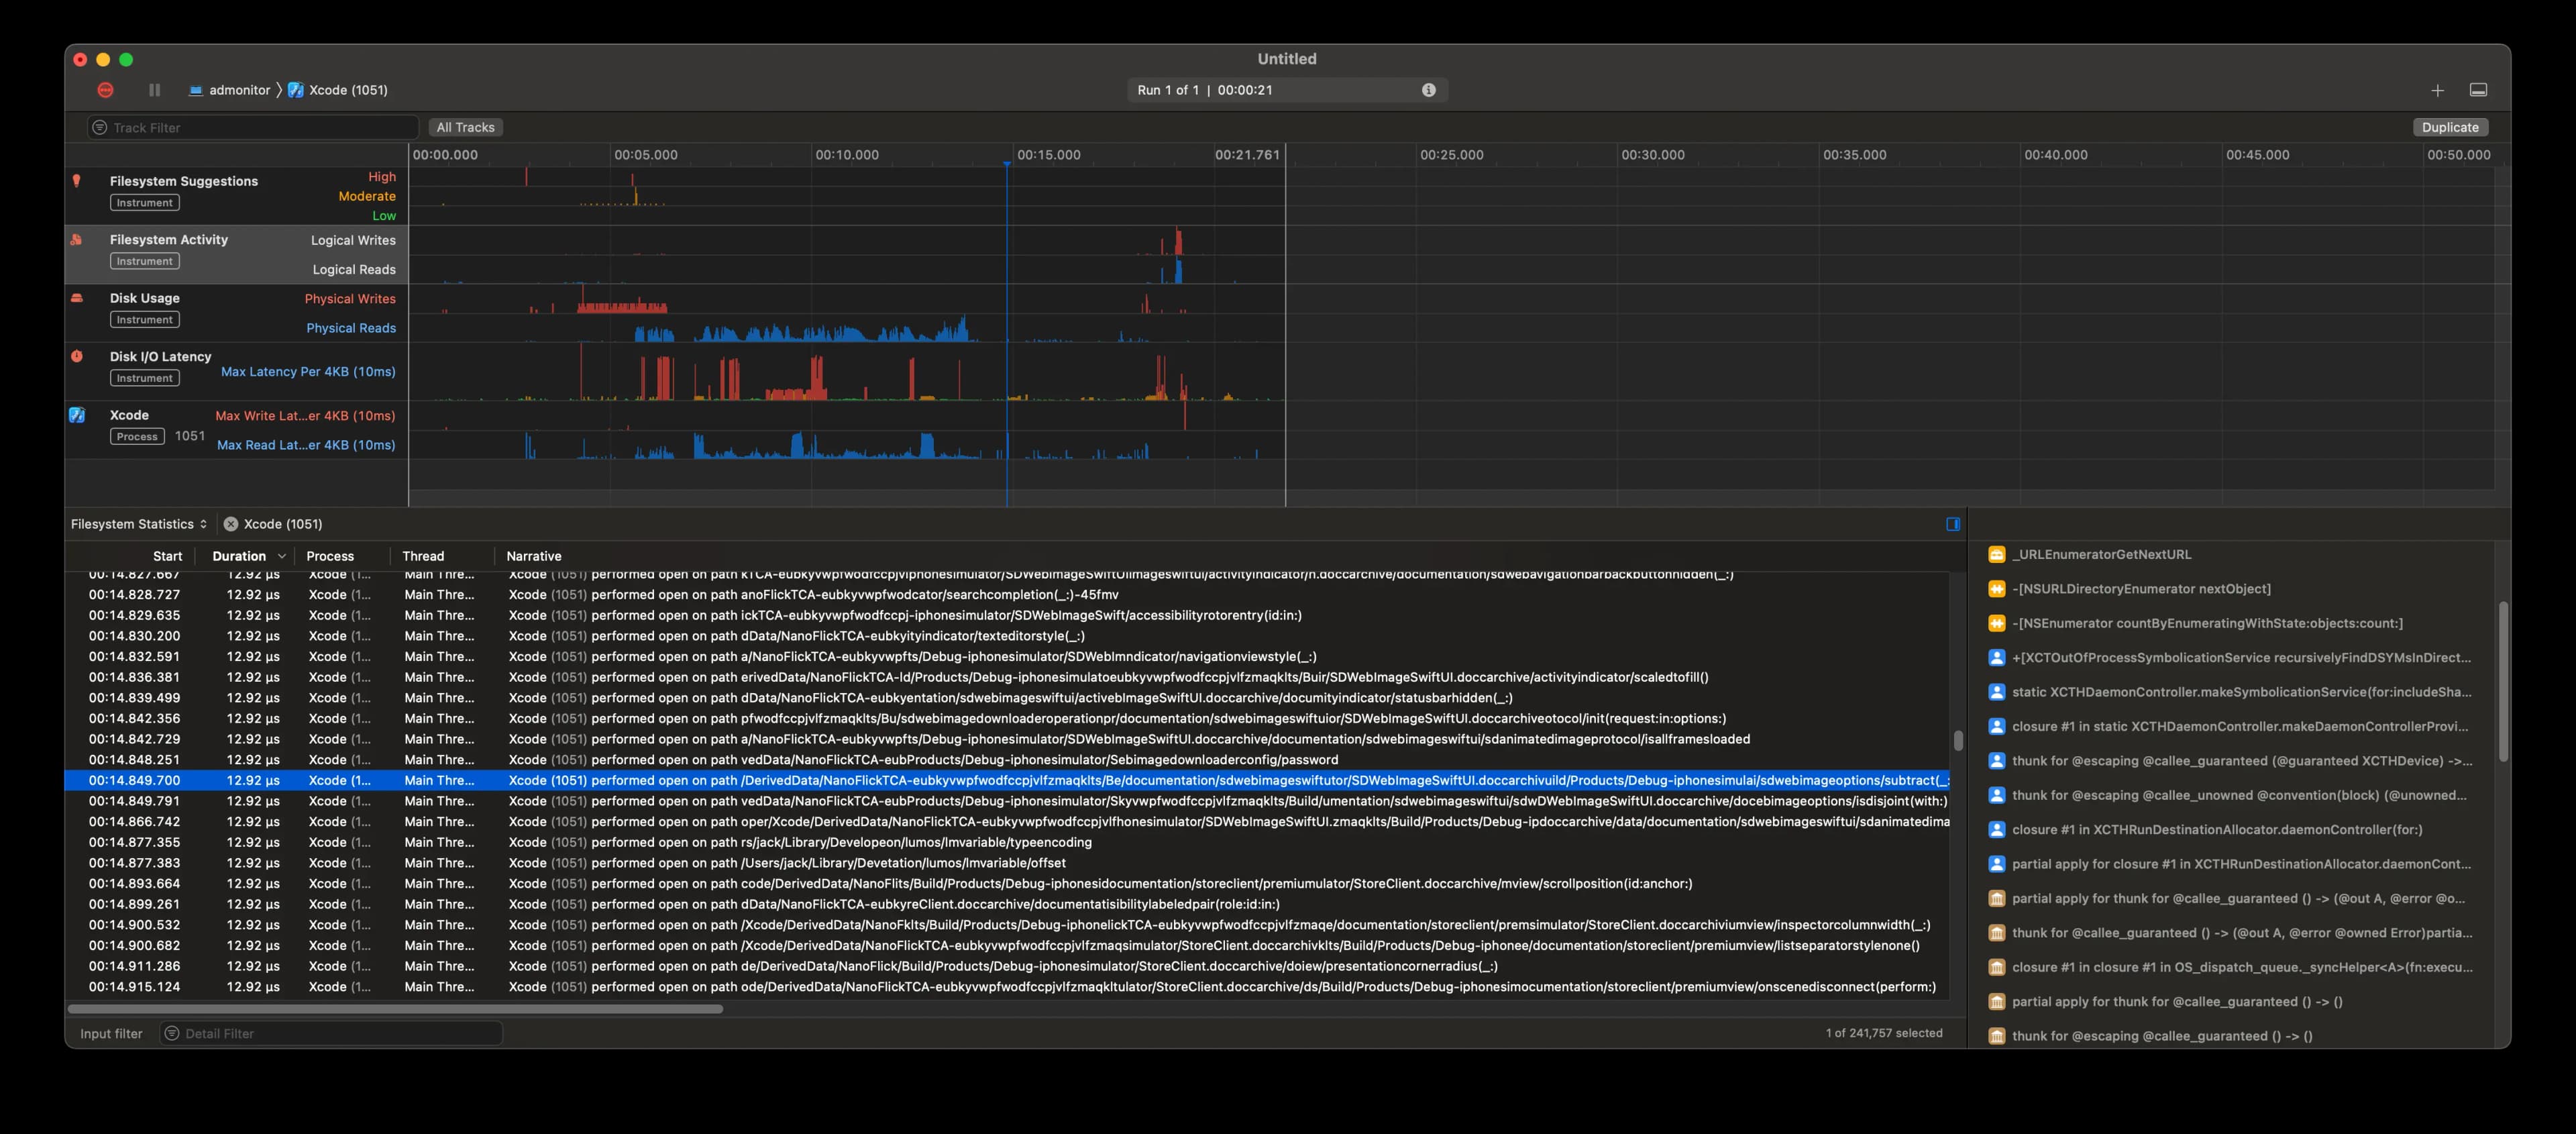
And we see that my suspicion was correct - all of the corrupted strings are in my derived data build folder. I'm very very surprised to see LOTS of paths relating to documentation builds of all things. My current hypothesis:
- The search for dSYMs is recursive, and it's searching my build artifacts folder.
- While some of these folders were rather wide, they were never both wide and deep, so the search was never too slow, except on the biggest of projects (see: uber's migration experience). Most people don't notice.
- This feature works fine, ages, has tons of dependencies built off of it, and becomes hardhardhard to change, but again, nobody notices, so fine.
- Xcode introduces buildable DocC in Xcode 13. Most people don't use it or build the documentation, so it's fine.
- Little enterprising Jack tries out the build documentation feature, forgets about it, writes tests later, and wonders if it just always hung and launched this slow and never noticed.
In order to validate this hypothesis, a disk usage analysis tool like dust would be great, but I need metadata-only statistics. Fortunately, dust actually supports this with -f! It's technically not what we want (we're more concerned about deep nesting), but it's a good start. We see NanoFlick, which has a much less severe case of this problem, with 94k files in the Build directory and the rewrite with 900k files in the Build directory, with the biggest single contribution being made by the SwiftSyntax documentation at 80k files (you know, about the same as the entire NanoFlick project alone!).
We can check our claim with find . -name "*doccarchive*" | wc -l. That gives 221, but that was just counting the directories for the archives. Oops! Doing a more brute-force find . | rg -c "doccarchive" gives 800k, which would be about right for the difference between the two projects.
Fix and check
Now that we know the problem, we can fix it. I'm just going to clean the build folder and never build documentation again. There will still be the latency associated with the search, but it will be much less severe - I'll have to hang an annoying few hundred milliseconds every time I build, but that's better than hanging for 8 seconds every time I launch.
Cleaning takes a while, about two minutes. Kinda makes sense why! After cleaning, dust gives us 106k files. I hope that doesn't affect us too much! A full build takes about 75 seconds (woohoo uFeatures!) and we're left with 138k files. Much, much smaller!
Now, time to test, well, incremental testing. Did it work? See for yourself:
Conclusions
Don't press the Build Documentation button in Xcode. It's not worth it, just use the inline docs or Swift Package Index's docs. Most packages will have these, either via SPI's domain or their own.
Footnotes
See this great map to find where the VFS sits in the Linux kernel. It'll probably be in a similar place in other kernels, but I'm not familiar enough with them (or OSes in general) to say for sure. ↩
I learned so so much just by staring at this while writing this post. I highly recommend just googling random things you read on it. For example: the block layer schedulers listed in the diagram turn out to be detrimental to performance in benchmarks on modern nvme tech. ↩
The vnode of an actually existing file on a disk actually attached to the computer. Y'know, the old-fashioned, boring way where we plug it into a port or connect a cable to it. How boring! ↩
Like, a lot of string corruption. I don't think I can see a single complete path, and I usually can't even see full path fragments - there are splits on random spots. Crazy. ↩